Defying experts’ expectations, rates have yet to plateau, portending nothing short of catastrophe for families and our besieged social services systems.
Deluge: our schools, disability services systems, and community programs have been flooded by ever-growing numbers of disabling autism cases. The data solidly point to a very real, if inexplicable, increase in autism over the past three decades. (Stock photo)
By Jill Escher
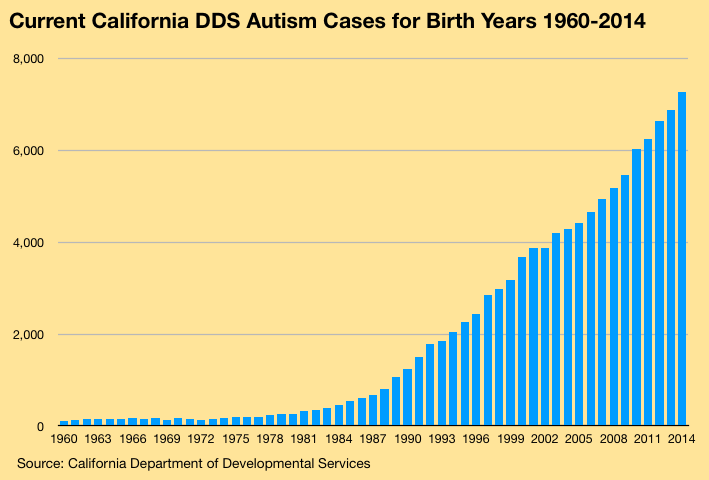
Current California Department of Developmental Services autism cases for birth years 1960-2014. The system now sees more than 300 additional autism cases per birth year over the prior birth year. Overall, California counted about 3,000 developmental disability-type autism cases in the mid 1980s. Today the number exceeds 122,000. (Rates for 2015-2019 births dip, consistent with the usual delay in entering the DDS system, not indicative of any slowing of growth.)
Source: California Department of Developmental Services, January 2020 data.
A decade ago in autism research circles it was commonly assumed that autism rates, which had mysteriously skyrocketed between 1980 and 2010, would quickly plateau. But the opposite is occurring: rates are accelerating.
Data from the California Department of Developmental Services, which tracks only developmental-disability type autism cases, shows 451 autism cases from birth year 1984 (those who turn 36 this year), compared to 7,273 cases for birth year 2014 (those who turn 6 this year), with hundreds more born in 2014 expected to seek admittance. The yellow graph illustrates the data.
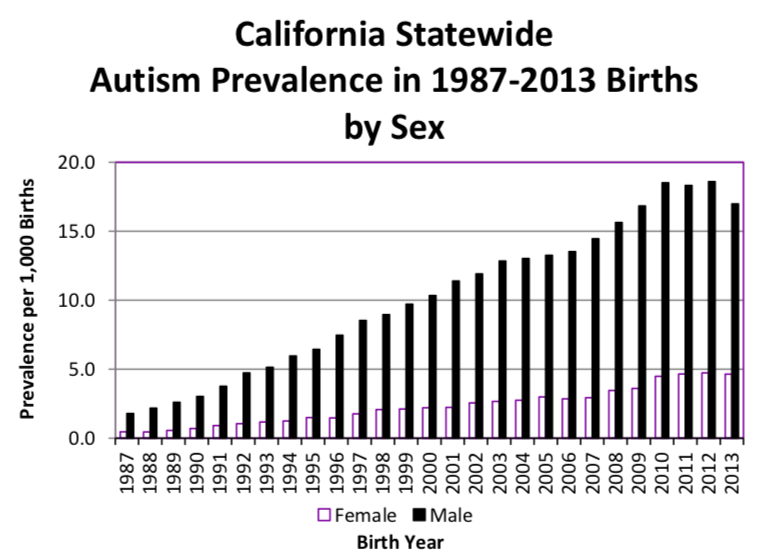
Prevalence of DDS-eligible autism, 1987-2013, for males and females born in the state to California resident mothers. (The drop-off in 2011-2013 is attributable to the usual lag in case entry into the DDS system.)
Source: California Department of Public Health based on 2018 DDS.data.
The pace of growth is accelerating: whereas for births in the 2000s we were adding about 230 DDS autism cases each year over the prior birth year, we are now adding about 400 for births in the 2010s. From a total caseload point of view, DDS counted about 3,000 autism cases in 1987, whereas today the number exceeds 122,000, a more than 40-fold caseload increase over 30 years. To put this massive number into perspective, the DDS was in shock when its autism cases spiked from about 4,000 in 1987 to about 13,000 cases in 1998, and now the number is nearly ten times that.
Dispelling any notion that population growth is driving the autism increase, in analyzing prevalence of DDS autism among those live-born in the state, the California Department of Public Health has found a 10-fold increase from 1.1 cases per 1,000 births in 1987 to 11.0 cases per 1,000 births in 2013 (see figure at left). Unpublished prevalence data from the department shows that as of 2012 births more than 2% of all males born in the state end up as DDS autism cases, a situation for which the state has no precedent.
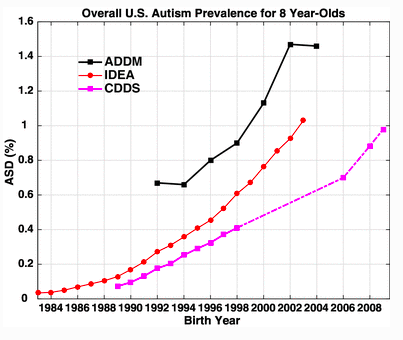
Comparison of increasing autism prevalence from 2004-2010 among 8 year-olds from the national IDEA (red), ADDM network (black), and California DDS (pink). Whether autism is defined restrictively (DDS) or more broadly,, the trends are similar. Source: Graph from Nevison et al. 2018.
California is our most populous state, with about 40 million residents, which is larger than the entire country of Canada, and it is renowned for maintaining the best records on developmental disability-type autism. Autism in the DDS system represents just a portion of the state’s overall autism cases, encompassing only those who have sought entry into the system and who were then deemed eligible due to substantial impairment in at least three areas of basic functioning such as learning, language, self-care and capacity for independent living. Higher functioning autism cases are largely excluded from the system. There has been no broadening of autism diagnoses in DDS—to the contrary, the state enacted more stringent eligibility criteria in 2003. In short, what you see in California DDS is generally an apples-to-apples comparison, or even more narrowed in recent years.
Moreover, multiple reports investigating the nature of the DDS autism rise have found no evidence for diagnostic shifts, general population growth, or immigration explaining the increase (see Appendix). Additionally, there is not an iota of evidence that DDS and its statewide network of regional centers, which have been charged with an affirmative duty of autism case-finding under our state’s Lanterman Act, have missed a football stadium’s worth of developmentally disabled autistic adults. It’s hard to overlook these cases, as they typically necessitate supervision to address daily needs, such as making food, getting dressed, paying a bill, working (if capable), communicating, attending to hygiene and health needs, and traveling in the community. And often they exhibit challenging behaviors. These individuals would have been diagnosed with something in the developmental disability orbit, and many would have been institutionalized. But at its peak in the 1960s California institutionalized just 16,000 people, only a small fraction of whom had autism.
In the California schools, which adhere to a broader definition of autism, autism cases in Special Education have also skyrocketed, from 14,038 cases in 1990 to 120,089 in 2018, an 855% increase (figure at left). Special education budgets have spiraled, with the biggest increase driven by the proportion of children diagnosed with autism, rising from 1 in 600 students in 1997-98 to 1 in 50 students in 2017-18, a 12-fold increase.
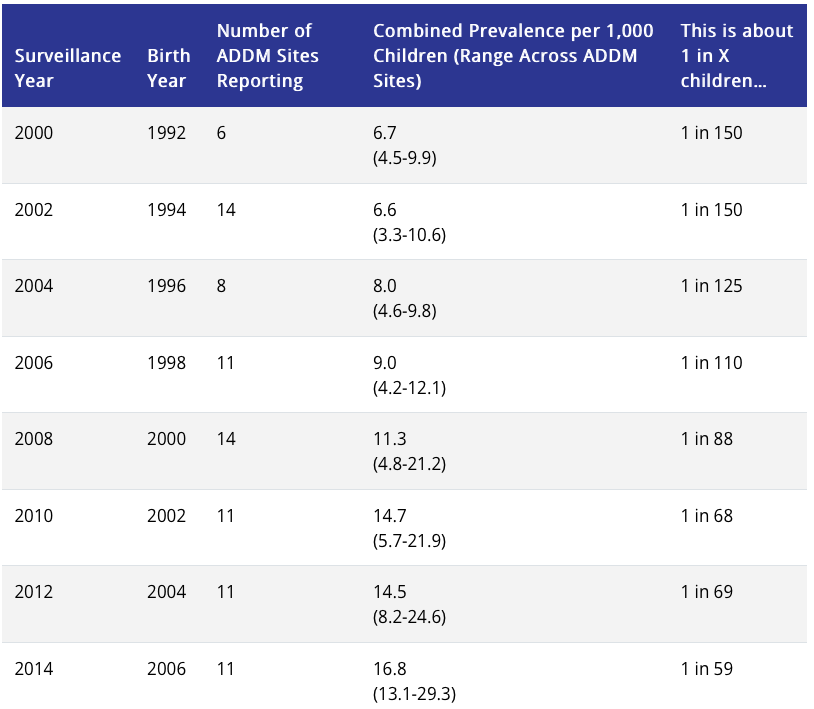
California trends, though stretching back further than national data, seem consistent with data from the national monitoring network run by the Centers for Disease Control (CDC). The CDC’s Autism and Developmental Disabilities Monitoring (ADDM) network estimates that in 2014 about 1 in 59 eight year-olds had autism, or 16.8 per 1,000. This is considerably higher than the 11.0 per 1,000 prevalence reported by the California Department of Public Health, but keep in mind that the California numbers are limited to more impairing forms of autism. See this study for a detailed view.
Over just 14 years we have seen national prevalence grow from 1 in 150 to 1 in 59, a 2.5-fold increase. Recently published studies indicate that national prevalence is likely even higher. According to the National Survey of Children’s Health, and the 2016 National Health Interview Survey, about 1 in 40 children in the United States has autism. In addition, a recent study found that 25% of children with autism younger than age 8 in the ADDM sites were not yet diagnosed. In sum, autism rates both in California and nationally show no signs of leveling off. The CDC summarizes its ADDM findings of 14 years of increasing autism prevalence in the figure below.
Source: https://www.cdc.gov/ncbddd/autism/data.html
Outside of the US, autism rates seem to vary considerably, but a recent report from Denmark showed that its population’s autism trends are consistent with US data, revealing no plateau in more recent birth years, suggesting that ASD prevalence by birth year has not stabilized. “The ongoing increases at young ages in more recent cohorts suggest that future cumulative incidence could exceed 2.8%,” report the authors. Similarly, in Northern Ireland, a recent report indicated the prevalence of childhood autism nearly trebled to about 3.3 percent from about 1.2 percent ten years ago.
Catastrophic long-term implications
Collectively, the data paint a devastating picture: despite prognostications to the contrary, the autism numbers continue to climb with no signs of abating. At the most recent International Society for Autism Research conference I found that epidemiologists in attendance generally thought that prevalence among children in developed countries was nearing 3%, a number consistent with the most recent data.
Meanwhile, this relentless upsurge is going largely ignored at a time when we desperately need a national autism plan, not to mention viable treatments to improve functional outcomes, and research that will finally identify the roots of this devastating epidemic. Reporters, having largely bought the “epidemic of awareness” and “neurodiversity” fictions, won’t touch it. Researchers like Eric Fombonne in Oregon and Terry Brugha in the UK notoriously twist data into pretzels to downplay it (possibly for fear of stoking dangerous anti-vaccine sentiments). And policymakers are in something of a state of confused shock, reeling from the need to continually boost stretched-thin budgets for ever-more, and very costly, autism classrooms and services.
Unfortunately, public and private expenditures are likely to surge as ever-growing populations age out of the school system and into the adult system. National costs of autism are projected to reach $461 billion for 2025, with costs far exceeding those of diabetes and ADHD. Worse, even a conservative reading of the California DDS data suggests that in 20 years the number of developmentally disabled autistic adults will more than quadruple. And worse, an increasing portion of their parents, who will be 20 years older than they are today, will be infirm or deceased. The older adult autism population is currently so small that the number with elderly or deceased parents is fairly negligible. Yet this double-whammy that should be driving the national autism conversation—the exploding adult autism numbers and the inevitable decrepitude of aging parents—is almost entirely absent. To illustrate what lies around the corner for our system, there are currently only 829 DDS autism cases over the age of 60; in 20 years there will be about 4,000, based on the aging of the current cases. In 40 years, more than 60,000. Almost no research is devoted to refining these urgently needed projections or defining the policy changes that will be necessary to address the inevitable explosion in demand for housing and long-term care.
And even more terrifying, based on current trends, the onslaught of autism we have already experienced may be a mere prelude to a far more catastrophic future: it is entirely conceivable that before long, fully 5% of American children will be disabled by autism. We certainly cannot cope now, how will we cope then?
Before I close, this must be said: vaccines do not cause autism (please, vaccinate your children)
Americans have been watching with alarm as their families, neighborhoods, and schools have been swept up in autism’s tide. And with no explanation for why their local school districts now have 400 kids with obviously disabling autism, as opposed to just a dozen 30 years ago, they turn to various half-baked theories to try to make sense of it. Part of me can hardly blame them—Americans deserve answers about the roots of the autism epidemic, and science has failed to deliver them.
Tragically, the vaccine hypothesis has rushed in to fill this void. I will not repeat what other commenters have already explained (Wikipedia actually provides a decent summary), but, briefly, science has delivered at least some answers about autism and they solidly refute the idea, for example:
• The neurological pathologies of autism have origins in the early wiring of the brain, before administration of vaccines.
• A multitude of robust epidemiological studies could find no link between vaccines and autism.
• Autism is strongly heritable, that is, rooted in the sperm/egg of the parents (and this may include new glitches, not necessarily any ancestral code).
• Autism rates have continued to climb sharply despite a stable vaccine schedule, removal of thimerosal, and decreasing vaccination rates.
• If anything, vaccines are strongly protective against brain damage that could be caused by childhood infections such as rubella or meningitis.
Yes, we desperately need research that finally pinpoints the causes of autism’s dysregulated brain development, but in the meantime, one thing is clear: vaccines do not cause autism. To responsibly address our nation’s autism emergency we must come out of the scientific closet and openly admit we face a devastating epidemic without fear of emboldening a disproved theory.
Jill Escher is an autism research philanthropist with the Escher Fund for Autism, president of National Council on Severe Autism, a housing provider to adults with autism and developmental disabilities, immediate past president of Autism Society San Francisco Bay Area, and the mother of two children with nonverbal forms of autism. She would like to thank Autism Society San Francisco Bay Area for sharing its data. Jill is known for unapologetically speaking her mind and the foregoing is her personal commentary which does not necessarily reflect the views of any autism organization with which she is affiliated. She can be reached at jill.escher@gmail.com.
Appendix: Reports on California Autism Data
1999 Report
• In March 1999, alarmed by the unexpectedly sharp increase in the autism caseload since the 1980s, California DDS issued a report summarizing the rise in DDS-eligible autism between end of the year for years 1987 and 1998 (“1999 Report”).
• The 1999 Report concluded that the number of persons entering the system with autism had increased dramatically between 1987 and 1998 relative to the other developmental disabilities.
• The 1999 Report showed that at end of 1987, there were 3,902 persons with DDS autism, or 4.85% of the entire DDS caseload. By the end of 1998, there were 12,780 such individuals, representing 9.37% of the overall DDS caseload.
• The 1999 Report found that the rate of the autism increase was more than four times as great as the other diagnostic categories.
• The 1999 Report found that in 1998, there were 1,685 persons with autism enrolled in the DDS system, a “number of persons far exceed[ing] the expected number determined by traditional incidence rates.”
• The 1999 Report cautioned, “If present rates of intake continue, there will be a need for: (1) greater emphasis on long range planning to develop suitable methods of delivering services, [and] (2) strategies for development of new and abundant resources.”
• The 1999 Report documented the birth dates of Regional Center eligible persons with autism, and reflected that the increase in autism births began slowly in about 1980, spiking sharply by 1990.
• The data shown in the 1999 Report also reflected that from about 1960 through about 1977 there were 200 or fewer autism births per year comprising the California DDS population.
2002 Study
• The State commissioned a study, published in 2002, to examine whether expanded diagnosis, immigration, or other factors could have caused the sharp spike in autism cases (“2002 Study”).
• The 2002 Study stated: “It is natural to discount that which we do not understand or force it to fit a paradigm with which we are comfortable. This study has been an attempt to determine whether or not the increased numbers are due to a real epidemic, or if the rise in autism cases can be explained by factors that have artificially created that increase.”
• The 2002 Study stated: “Has there been a loosening in the criteria used to diagnose autism, qualifying more children for Regional Center services and increasing the number of autism cases? We did not find this to be the case.”
• The 2002 Study stated: “Has the increase in cases of autism been created artificially by having ‘missed’ the diagnosis in the past, and instead reporting autistic children as ‘mentally retarded?’ This explanation was not supported by our data.”
• The 2002 Study stated: “Without evidence for an artificial increase in autism cases, we conclude that some, if not all, of the observed increase represents a true increase in cases of autism in California, and the number of cases presenting to the Regional Center system is not an overestimation of the number of children with autism in California.”
• The 2002 Study summarized as major findings the following:
—”The observed increase in autism cases cannot be explained by a loosening in the criteria used to make the diagnosis.”
—”Some children reported by the Regional Centers with mental retardation and not autism did meet criteria for autism, but this misclassification does not appear to have changed over time.”
—”Children served by the State's Regional Centers are largely native born and there has been no major migration of children into California that would explain the increase in autism.”
2003 Report
• In 2003, DDS issued another report, called “Autistic Spectrum Disorders, Changes In The California Caseload, An Update: 1999 Through 2002,” published April 2003 (“2003 Report”),
• The 2003 Report found that the number of persons with autism entering the system continues to increase dramatically, and that, “In fact, the rate first documented in the 1999 Report has accelerated in the last four years. Autism is and will most probably continue to be the fastest growing disability served by the regional center system.”
• The 2003 Report stated that the DDS autism population had grown to 20,377 as of December 2002.
2007 Report
• In 2007, DDS issued a report called, “Autistic Spectrum Disorders, Changes in the California Caseload An Update: June 1987 – June 2007” (“2007 Report”).
• The 2007 Report found that from June 1987 through June 2007, California experienced a 12-fold increase in individuals with autistic disorder being served by DDS.and that this number did not include those on the autism spectrum subject to a broader definition.
• The 2007 Report found that, “Currently there are more than 38,000 people in California receiving services for ASD, growth that has averaged 13.4 percent annually since 2002.”
• Regarding adults with autism, the 2007 Report found that “Currently, approximately 6,000 adults with a diagnosis of autism receive services from DDS,” and that by 2018, “the number of adults with autism being served by DDS will triple, to more than 19,000.”
• The 2007 Report found that between 1990 and 2000, “the number of persons with autism being served by regional centers rose 26 times faster than that of the general California population.”
• The 2007 Report found that “The ratio of males to females with autism in the DDS system is 4.6 to 1, consistent across all counties and with the scientific literature.”
• The 2007 Report concluded: “This document represents 20 years of longitudinal data about people with ASD who are served by the state’s DDS through care coordinated by 21 nonprofit regional centers. During this time in California, unprecedented growth occurred in the number of people with this neurodevelopmental disorder. Currently, nearly 39,000 people in California receive services from DDS for ASD. Many findings emerged during these two decades, including a decline in the average age of people with autism, a sizeable age wave of youth approaching adulthood, an increasing proportion of males who have ASD, and a diagnostic stability over time.”
2009 Study
A 2009 study showed the shift from DSM-III to DSM-IV and the inclusion of less severely affected individuals, together with the younger age at diagnosis, could explain only a fraction, less than one-third, of the steady rise across 13 birth cohorts (1990-2002). This paper reported on the effect of age at diagnosis counting only to age 5, not age 10 as in the rest of the paper. It remains possible that counting cumulative incidence to age 10 would show little effect of age at diagnosis, making the effect of the DSM III to IV (and IV TR) shifts almost negligible in the DDS data.
2018 Study
A 2018 study found many considerations arguing against changing diagnostic criteria as the primary cause of the increasing prevalence including the “significant functional disability” criteria, and that although some milder cases may enter as very young children, the annual to triannual reviews screen later them out.


